
You've reached my old digital mapping portfolio, which I last worked on in 2019.
I am still figuring out how to best showcase the work I have done as a professional frontend developer in the years since — the bulk of which I don't have client permission to share publicly.
Feel free to have a look around, but please keep in mind that my skills have grown tenfold since I created the work featured here.
Click anywhere outside of this modal or press ESC or ENTER to continue.
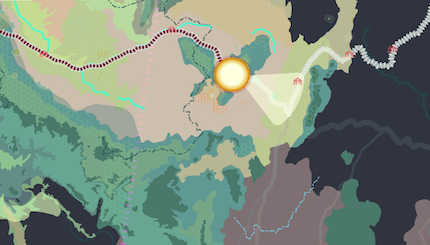
This map offers the user a virtual experience of traversing North America’s passenger rail routes amidst dynamically unfolding ecoregions, waterways, and protected areas. A togglable and height-adjustable dashboard at the base of the screen offers the user a dynamically populating legend/log of the categories encountered, lists the names of all encountered features in scrollable columns, and tracks traversed elevation, bearing, distance, and time. June 2018-June 2019.
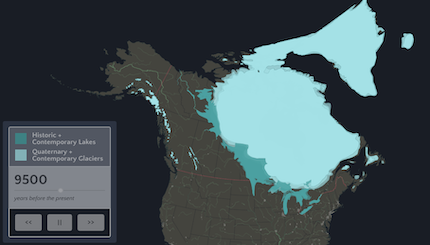
Three interrelated maps accessible via one single page application. Maps range from large scale animated timelapse of "Quaternary Glacial Retreat" across North America, include a view of the glacial geomorphology of the northern US in "Mapping Drift", and end with a local view of "What is Solid Here: Life in the Paleozoic Plateau", which dynamically pulls in the most recent wildlife observations occuring in the Driftless area of the upper midwest, as logged on iNaturalist. April-August 2019.
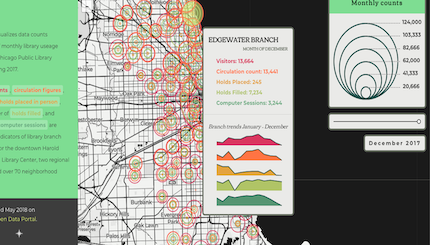
Proportional symbol map of parton usage of Chicago's public library system during 2017, with details by location. Sourced from Chicago's Open Data Portal. Made for NMP MAP673, Module 05. May 2018.
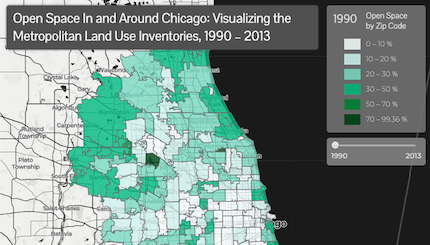
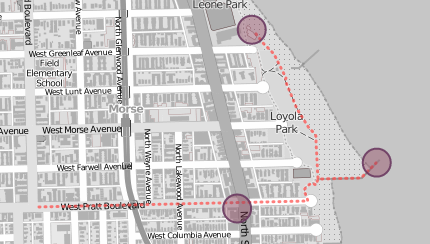
Choropleth map visualizes open space in the Chicago region by zip code between 1990 and 2013, with pop-ups illuminating details of land use by category. Data from the Chicago Metropolitan Agency for Planning (CMAP)'s Metropolitan Land Use Inventories. Built in partial fulfillment of NMP MAP673, Module 03. May 2018.
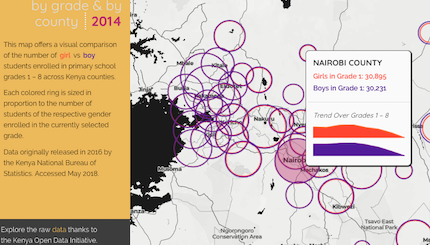
This map offers a visual comparison of the number of girl vs boy students enrolled in primary school grades 1 – 8 across Kenya counties in 2014. Each colored ring is sized in proportion to the number of students of the respective gender enrolled in the currently selected grade. May 2018.
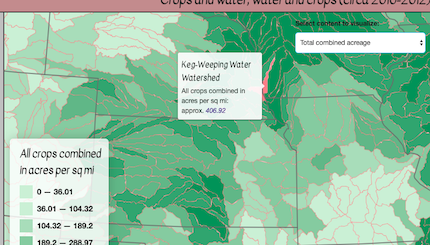
Choropleth map illuminates crop acreage and crop yield by water drainage subbasin for a variety of agricultural categories across the conterminous US. Data sourced from the Environmental Protection Agency's EnviroAtlas and the USDA's 2010 Cropland Data Layers. Built in partial fulfillment of NMP 673, Module 02. April 2018.
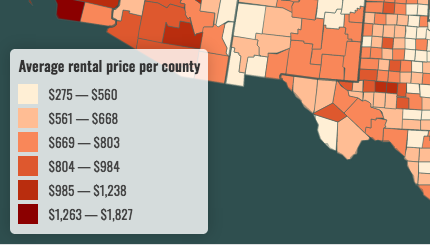
A dynamically drawn choropleth map showcased average rental prices by US county as of 2015. Data from the American Fact Finder and the US Census. Skills used: Leaflet.js, proj4Leaflet, jQuery. Made for NMP MAP672, Module 10. March 2018.
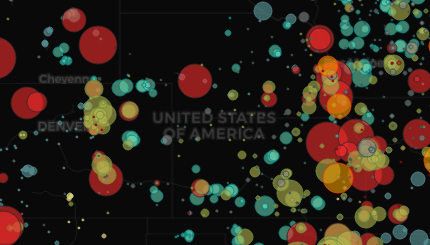
A map of powerplants in the contiguous US, as illustrated by proportional symbols indicative of total plant capacity in megawatts. This map features a togglable menu of category types and illustrative popups upon mouse hover. Doubleclicking a location on the map narrows visible plants to a preset radius. Data, originally from the US Energy Information Administration, was provided by NMP within the context of MAP672, Module 09. March 2018.
A simple route tracker that used GPX data. Preserved mainly for the writing that accompanied it. March 2018.
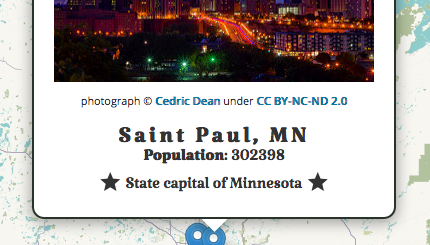
This map was made in fulfillment of the assignment for NMP MAP672 Module 04, the goal of which was to use JavaScript arrays, if/else statements, and `for` loops to mark the location of at least three different cities and provide relevant information about those cities through an associated popup or tooltip. Population data from the U.S. Census Bureau (estimates as of July 2016). February 2018.
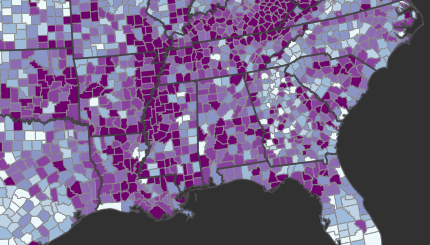
A choropleth map made using CartoDB in fulfillment of the Module 08 assignment for NMP MAP671. I prepared data from the National Cancer Institute using QGIS and PostGIS. This was the first map I made using CartoDB's platform. I projected the maps to EPSG:5070 as opposed to settling for webmercator. December 2017.
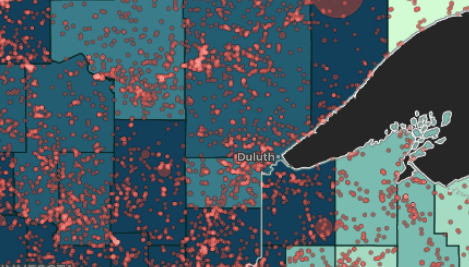
Combo choropleth & point data map made for NMP MAP671, Module 09 using CartoDB. Using SQL, worked with dataset from the USDA Forest Service to extract county-based statistics such as acres burned per sq km and cumulative burn time following initial fire discovery. Continued to play with CartoCSS as a means of rendering data appropriate to zoom level. December 2017.
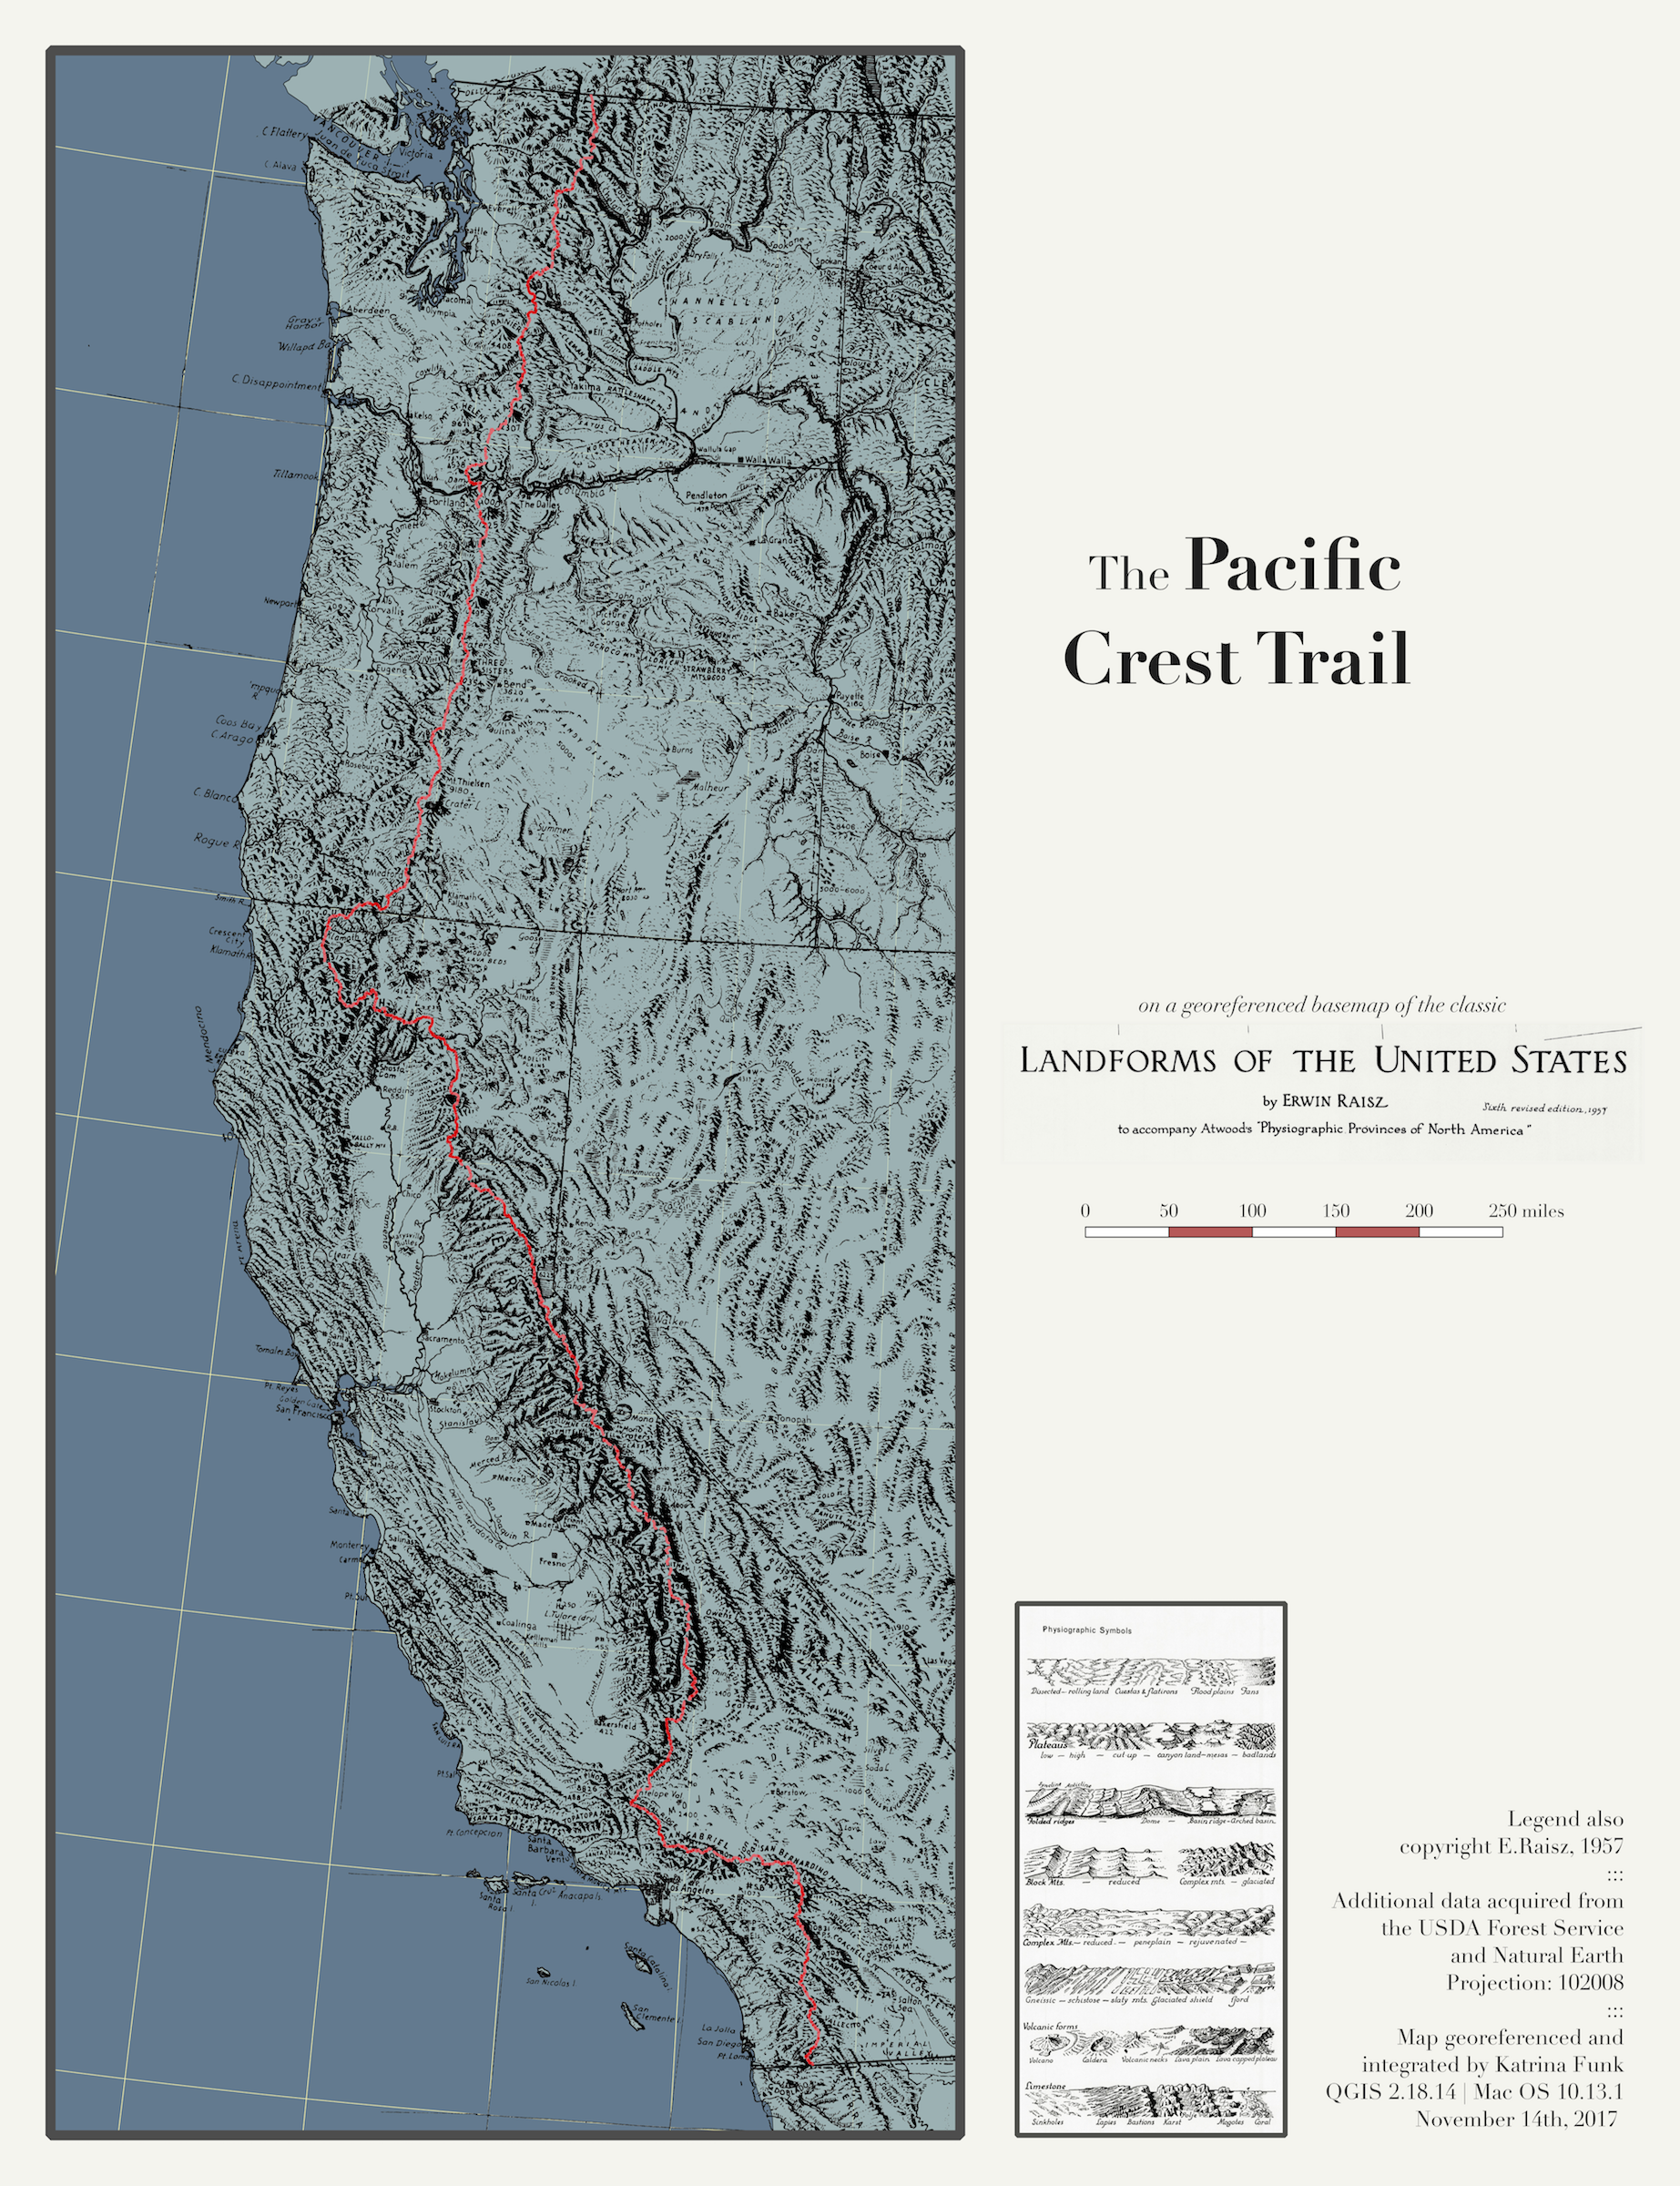
PCT vector data from the USDA Forest Service and Natural Earth. Basemap is classic by Erwin Raisz, 1957, georeferenced by me in QGIS. Assignment fulfilled NMP MAP671, Module 05. November 2017.
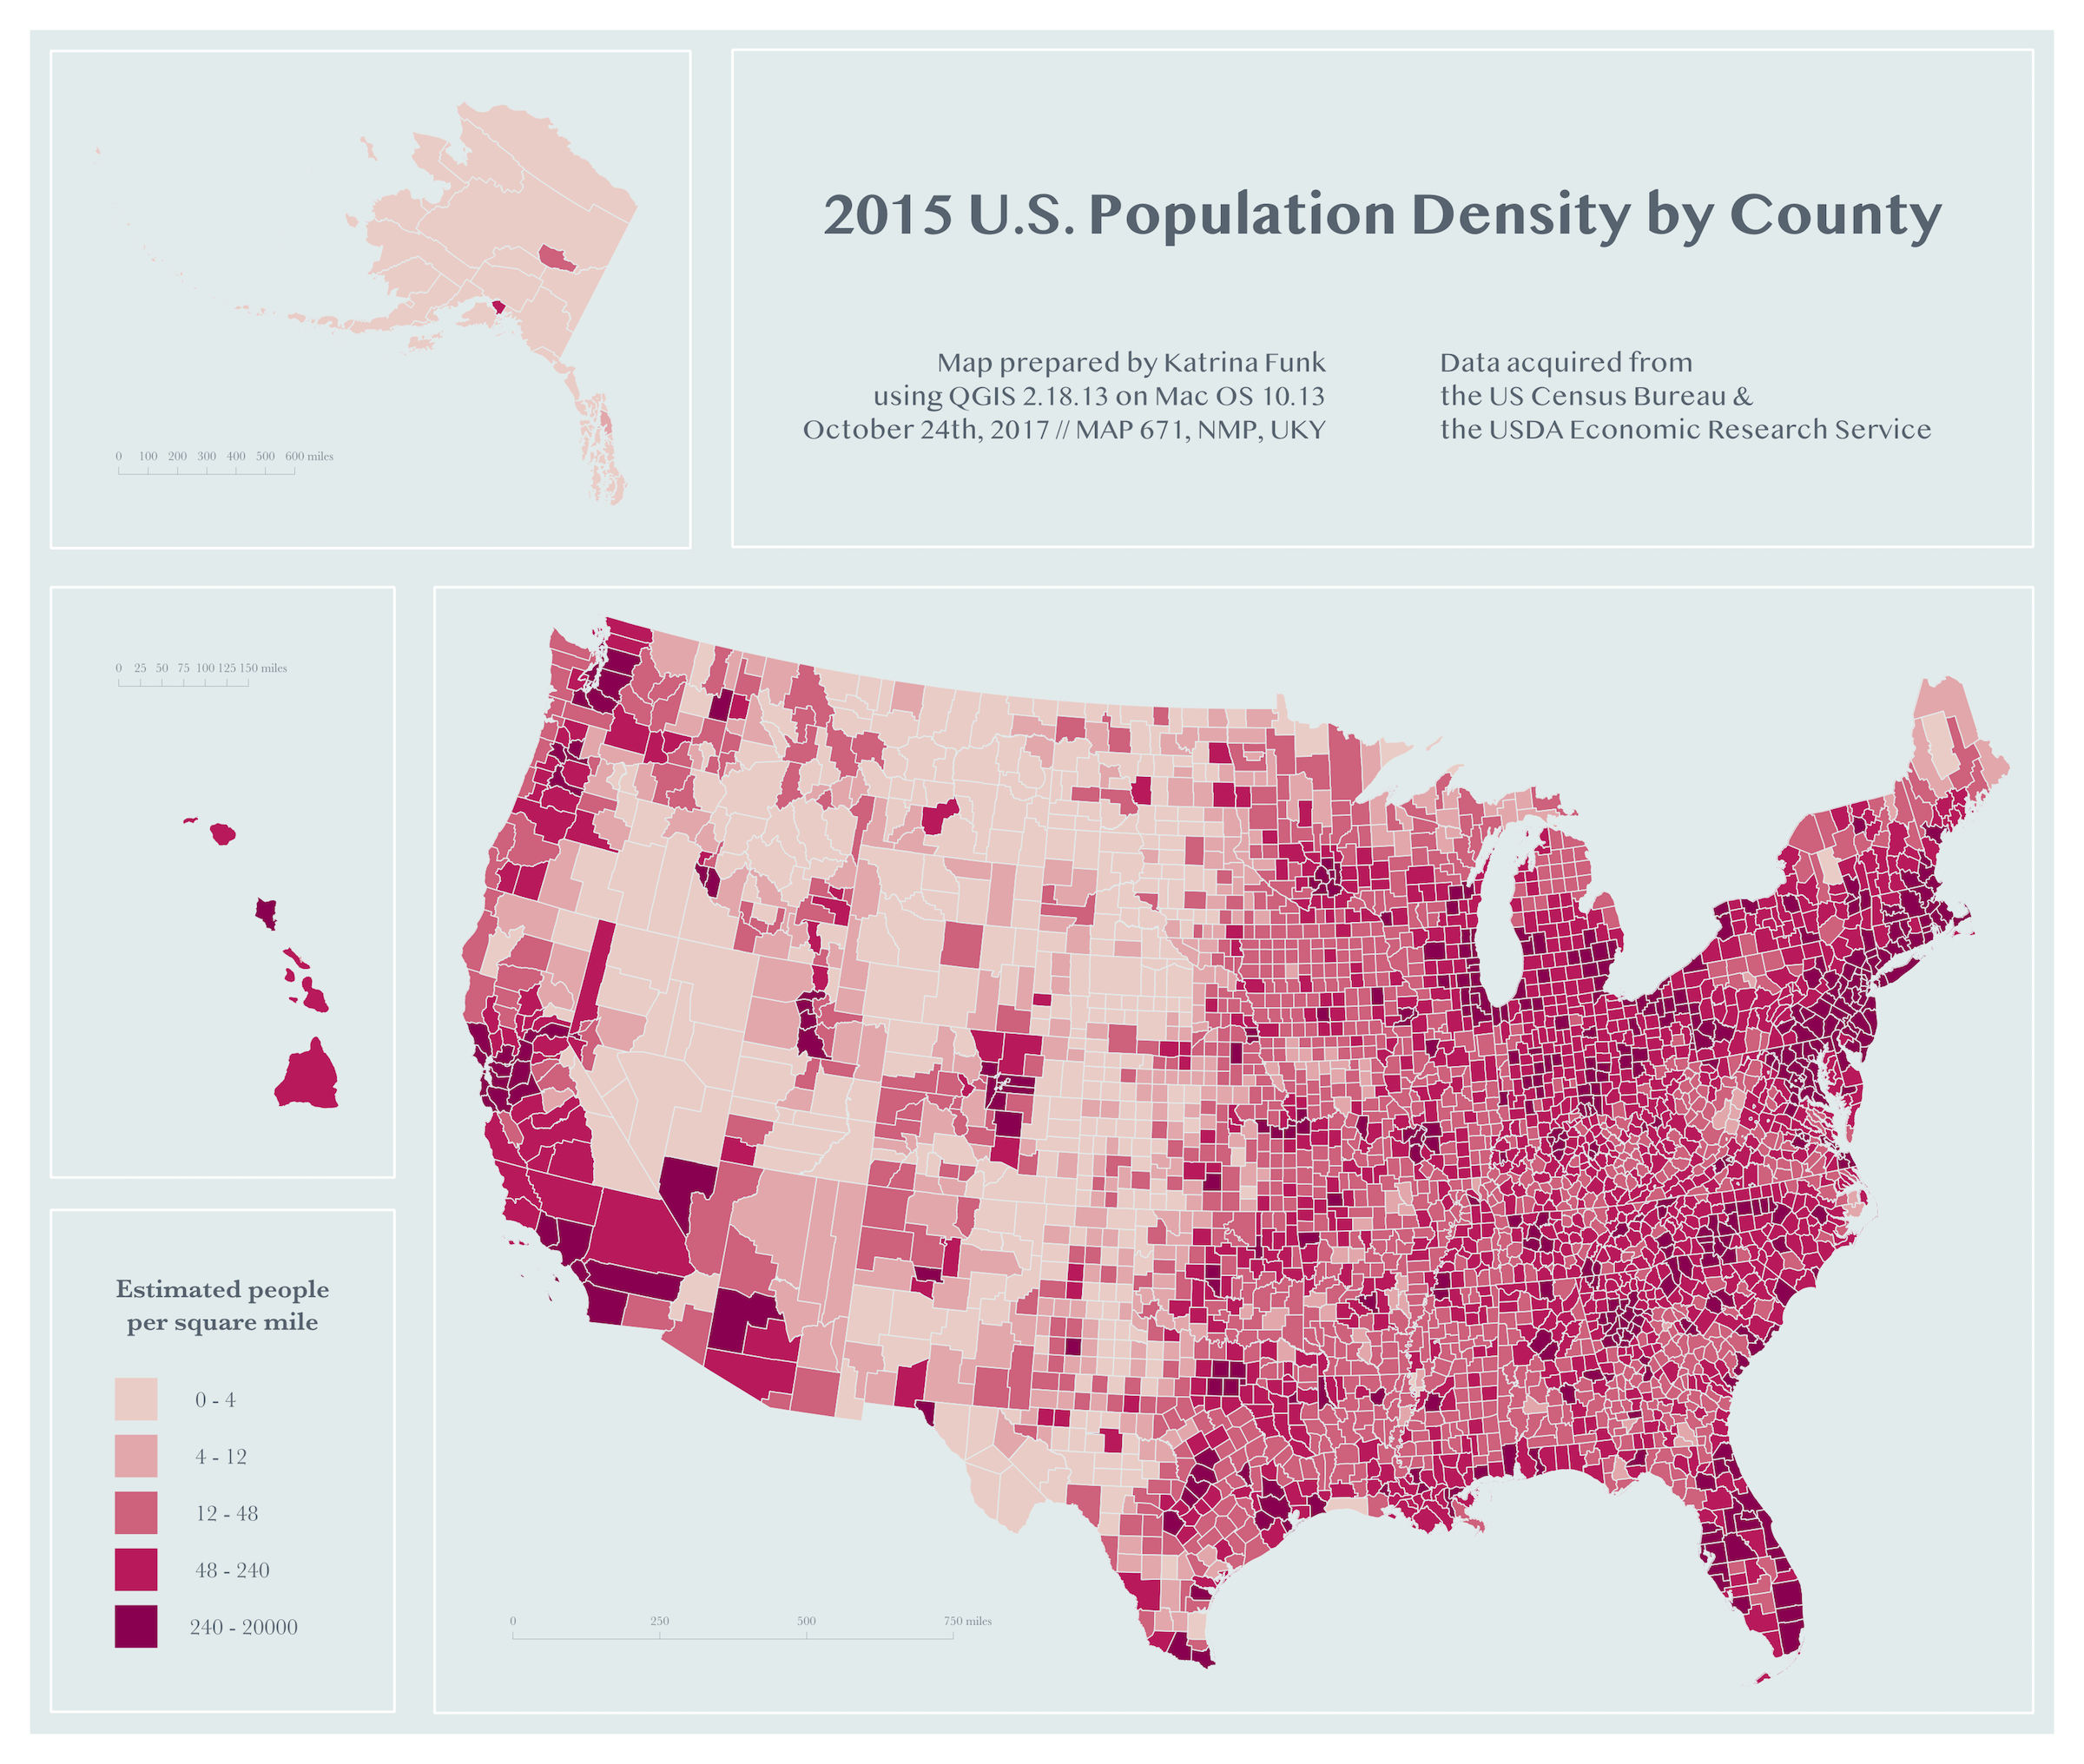
Static choropleth map with insets depicting 2015 US population density by county. Data from the US Census Bureau and USDA Economic Research Service, queried with PostGIS/SQL. Made with QGIS 2.18 for NMP MAP671, Module 02. October 2017.
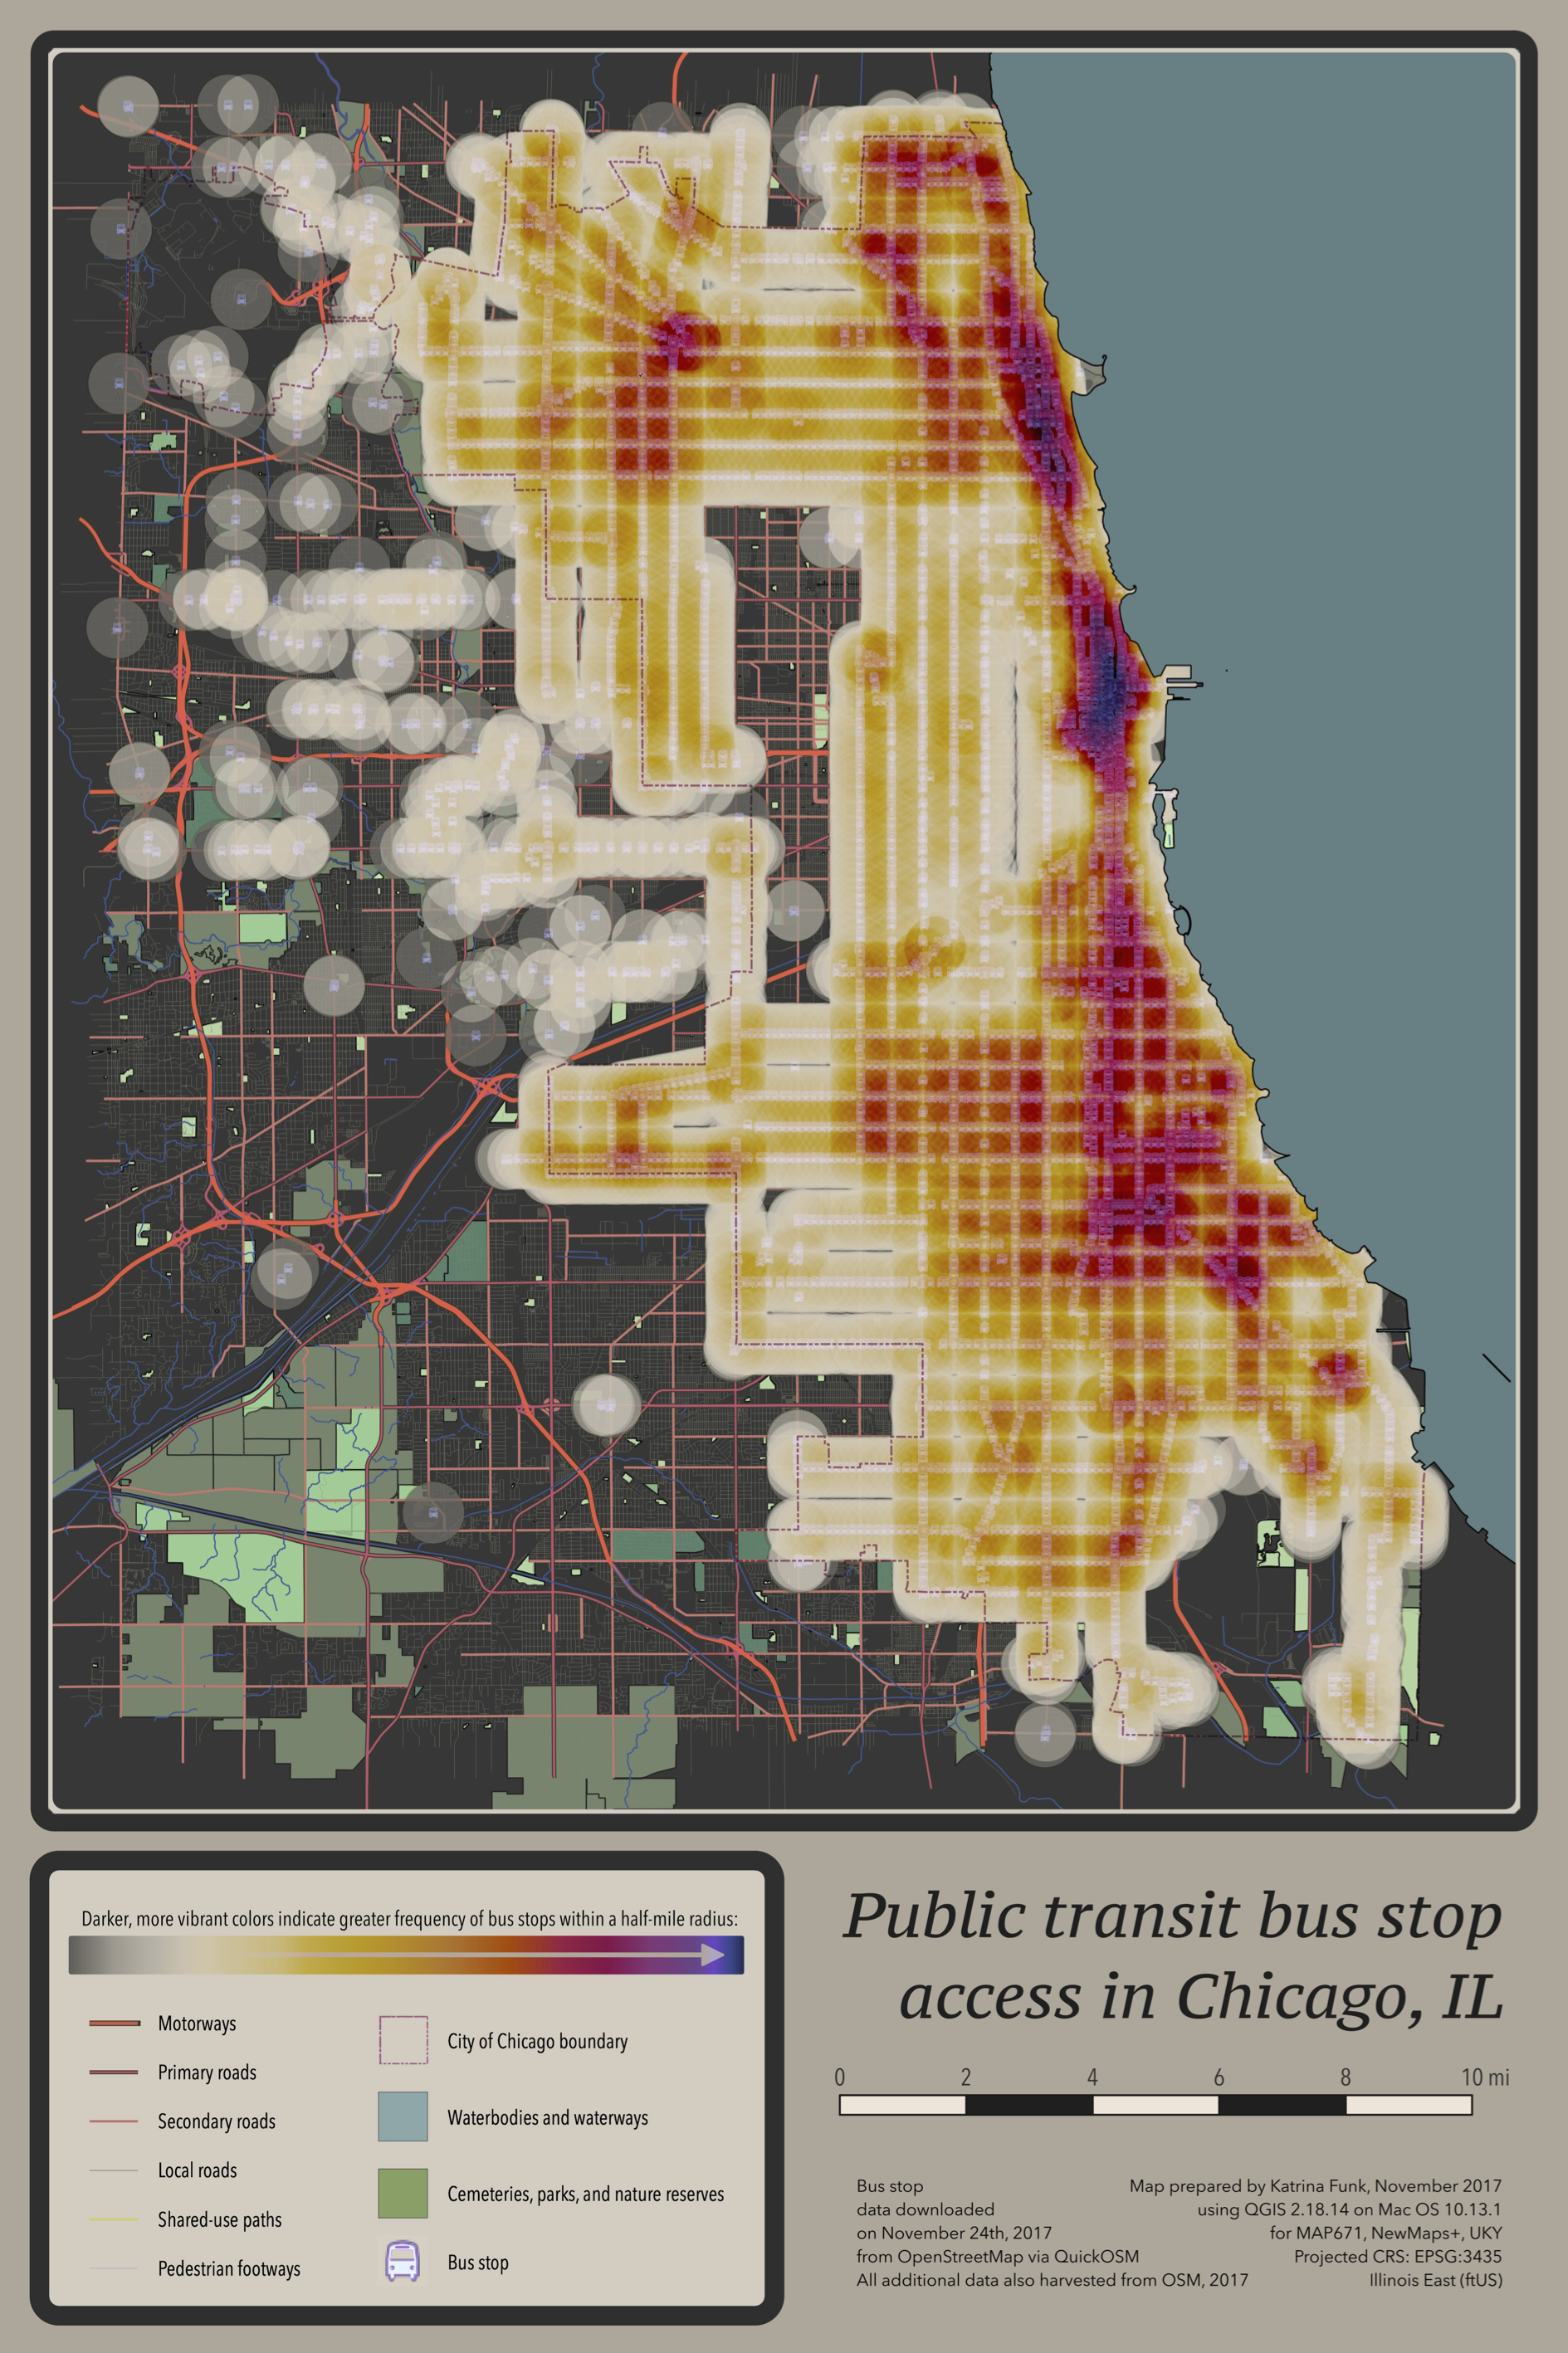
Heatmap of bus stop density in Chicago. Made in fulfillment of NMP MAP671, Module 06. Data from OpenStreetMap. November 2017.
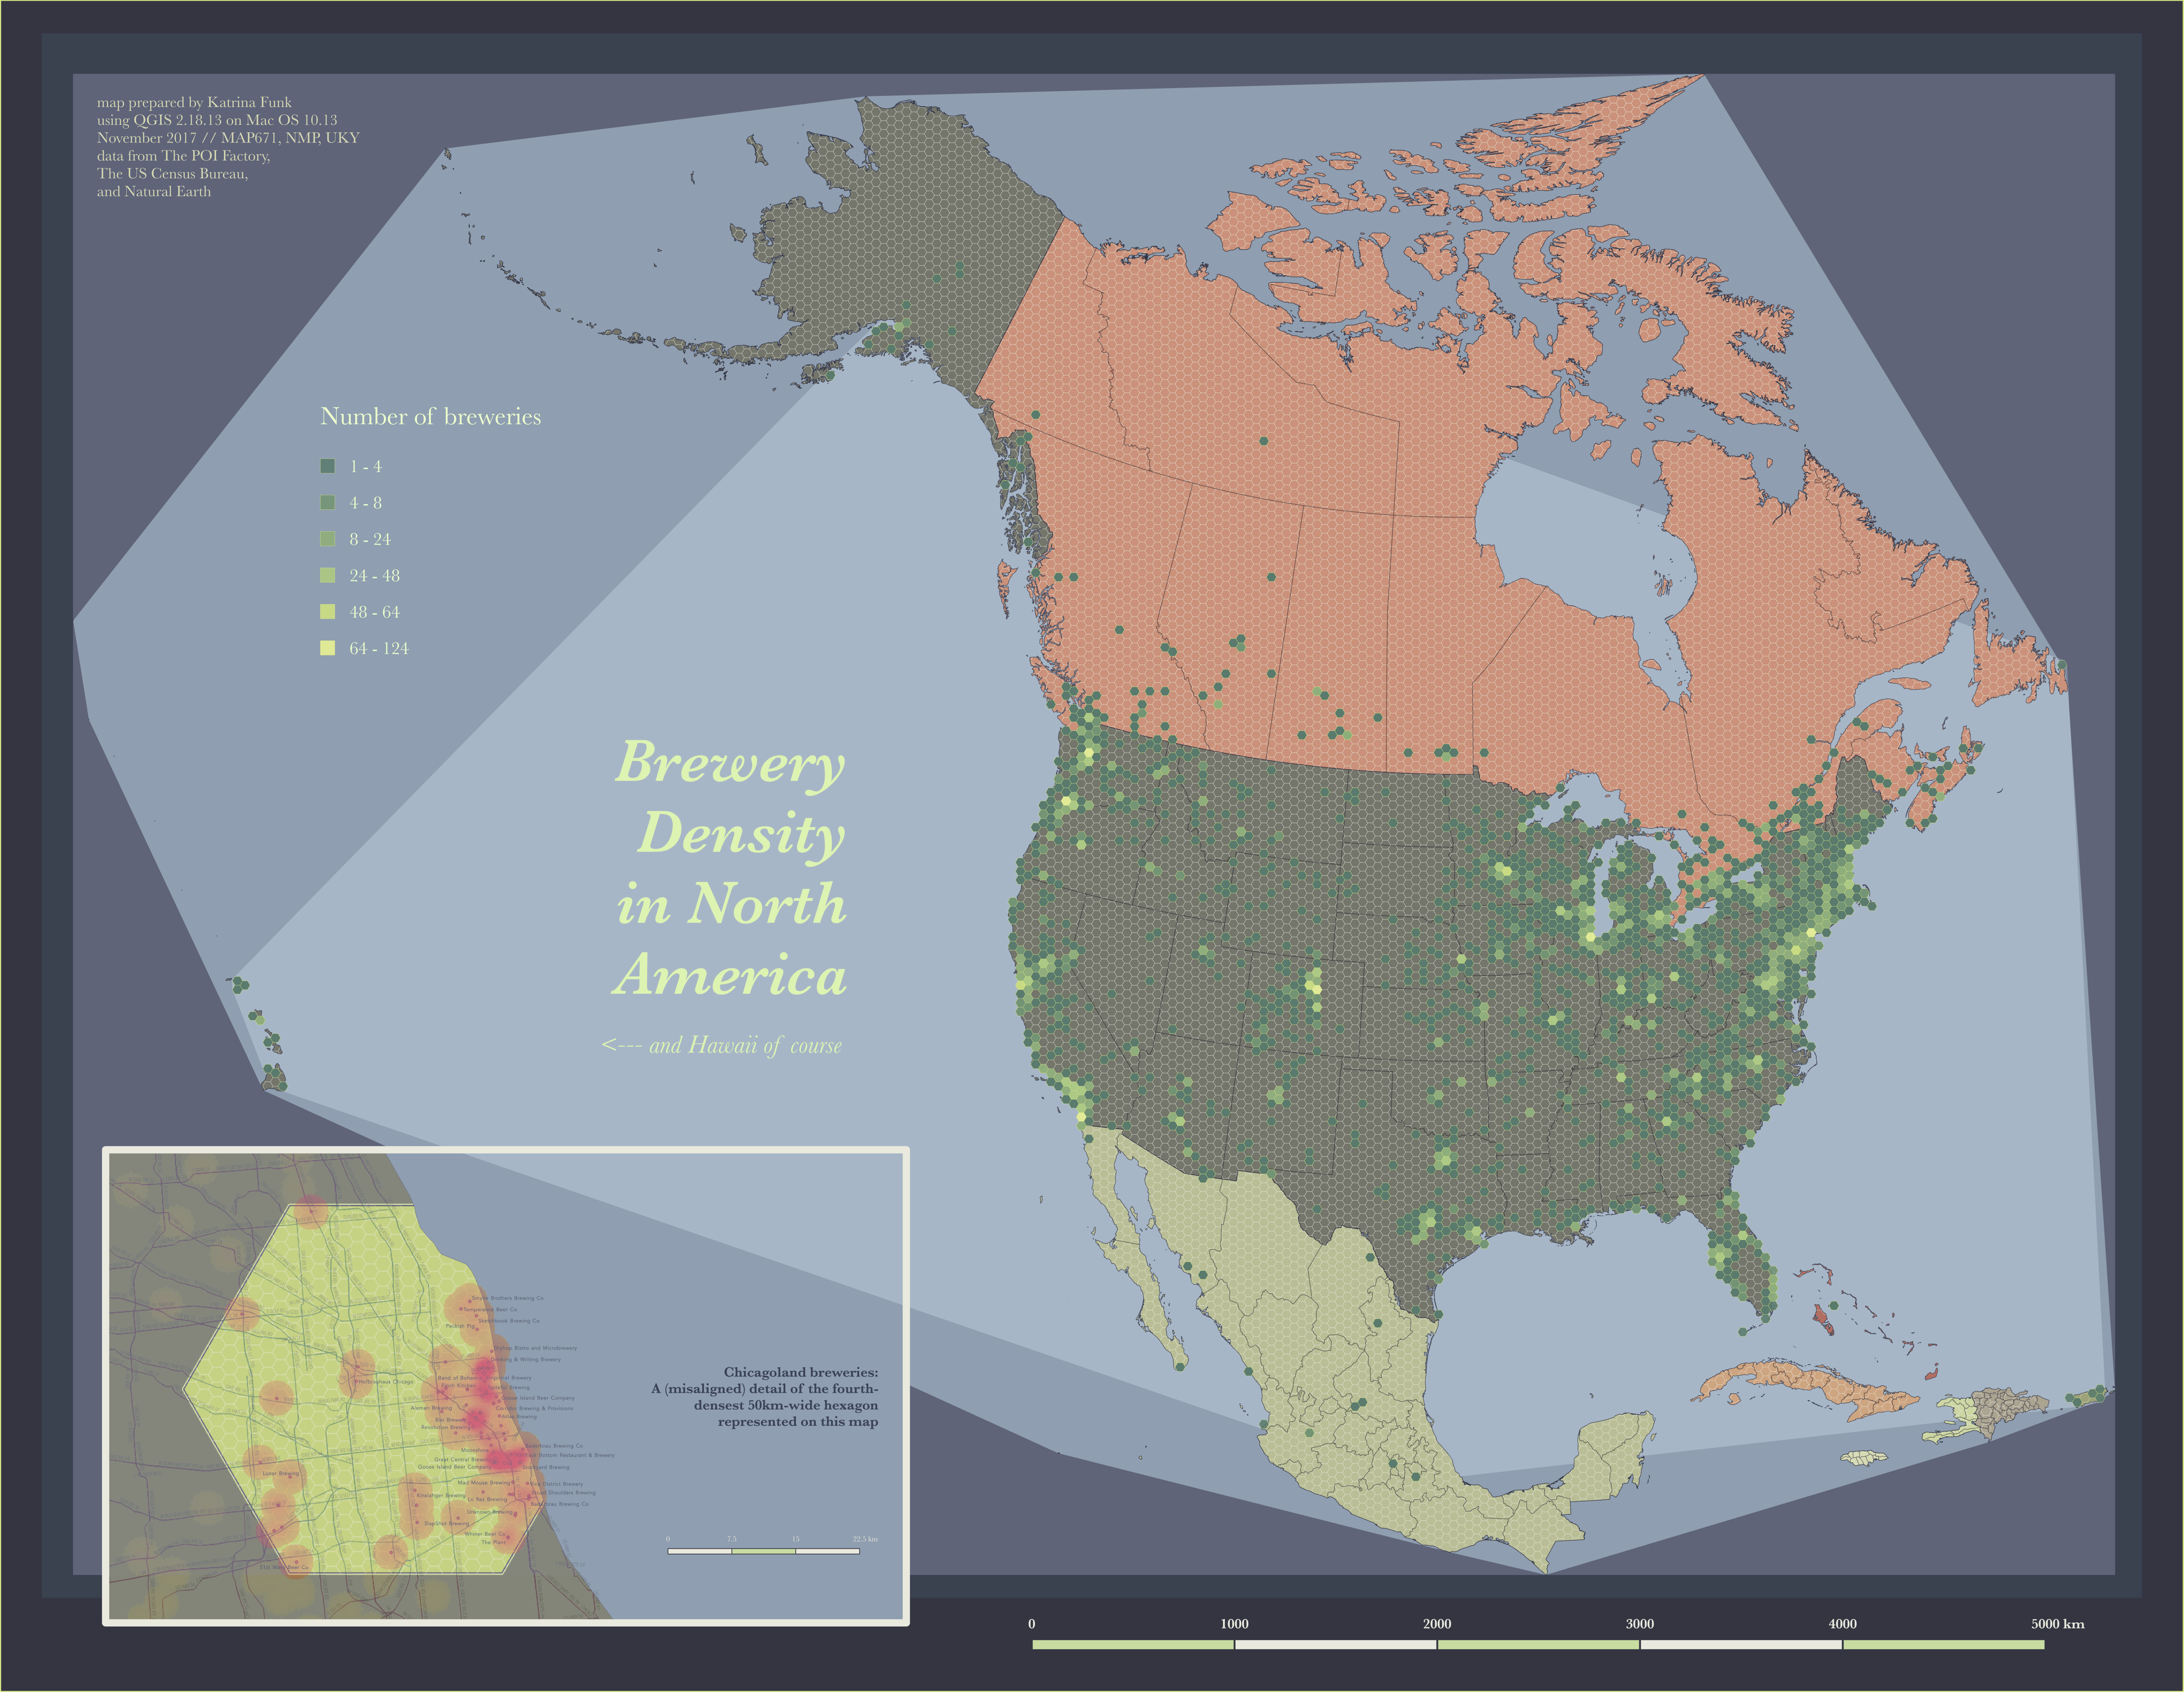
Hexbinning away. Made in fulfillment of NMP MAP671, Module 04. Data from the POI Factory, the US Census Bureau, and Natural Earth. November 2017.
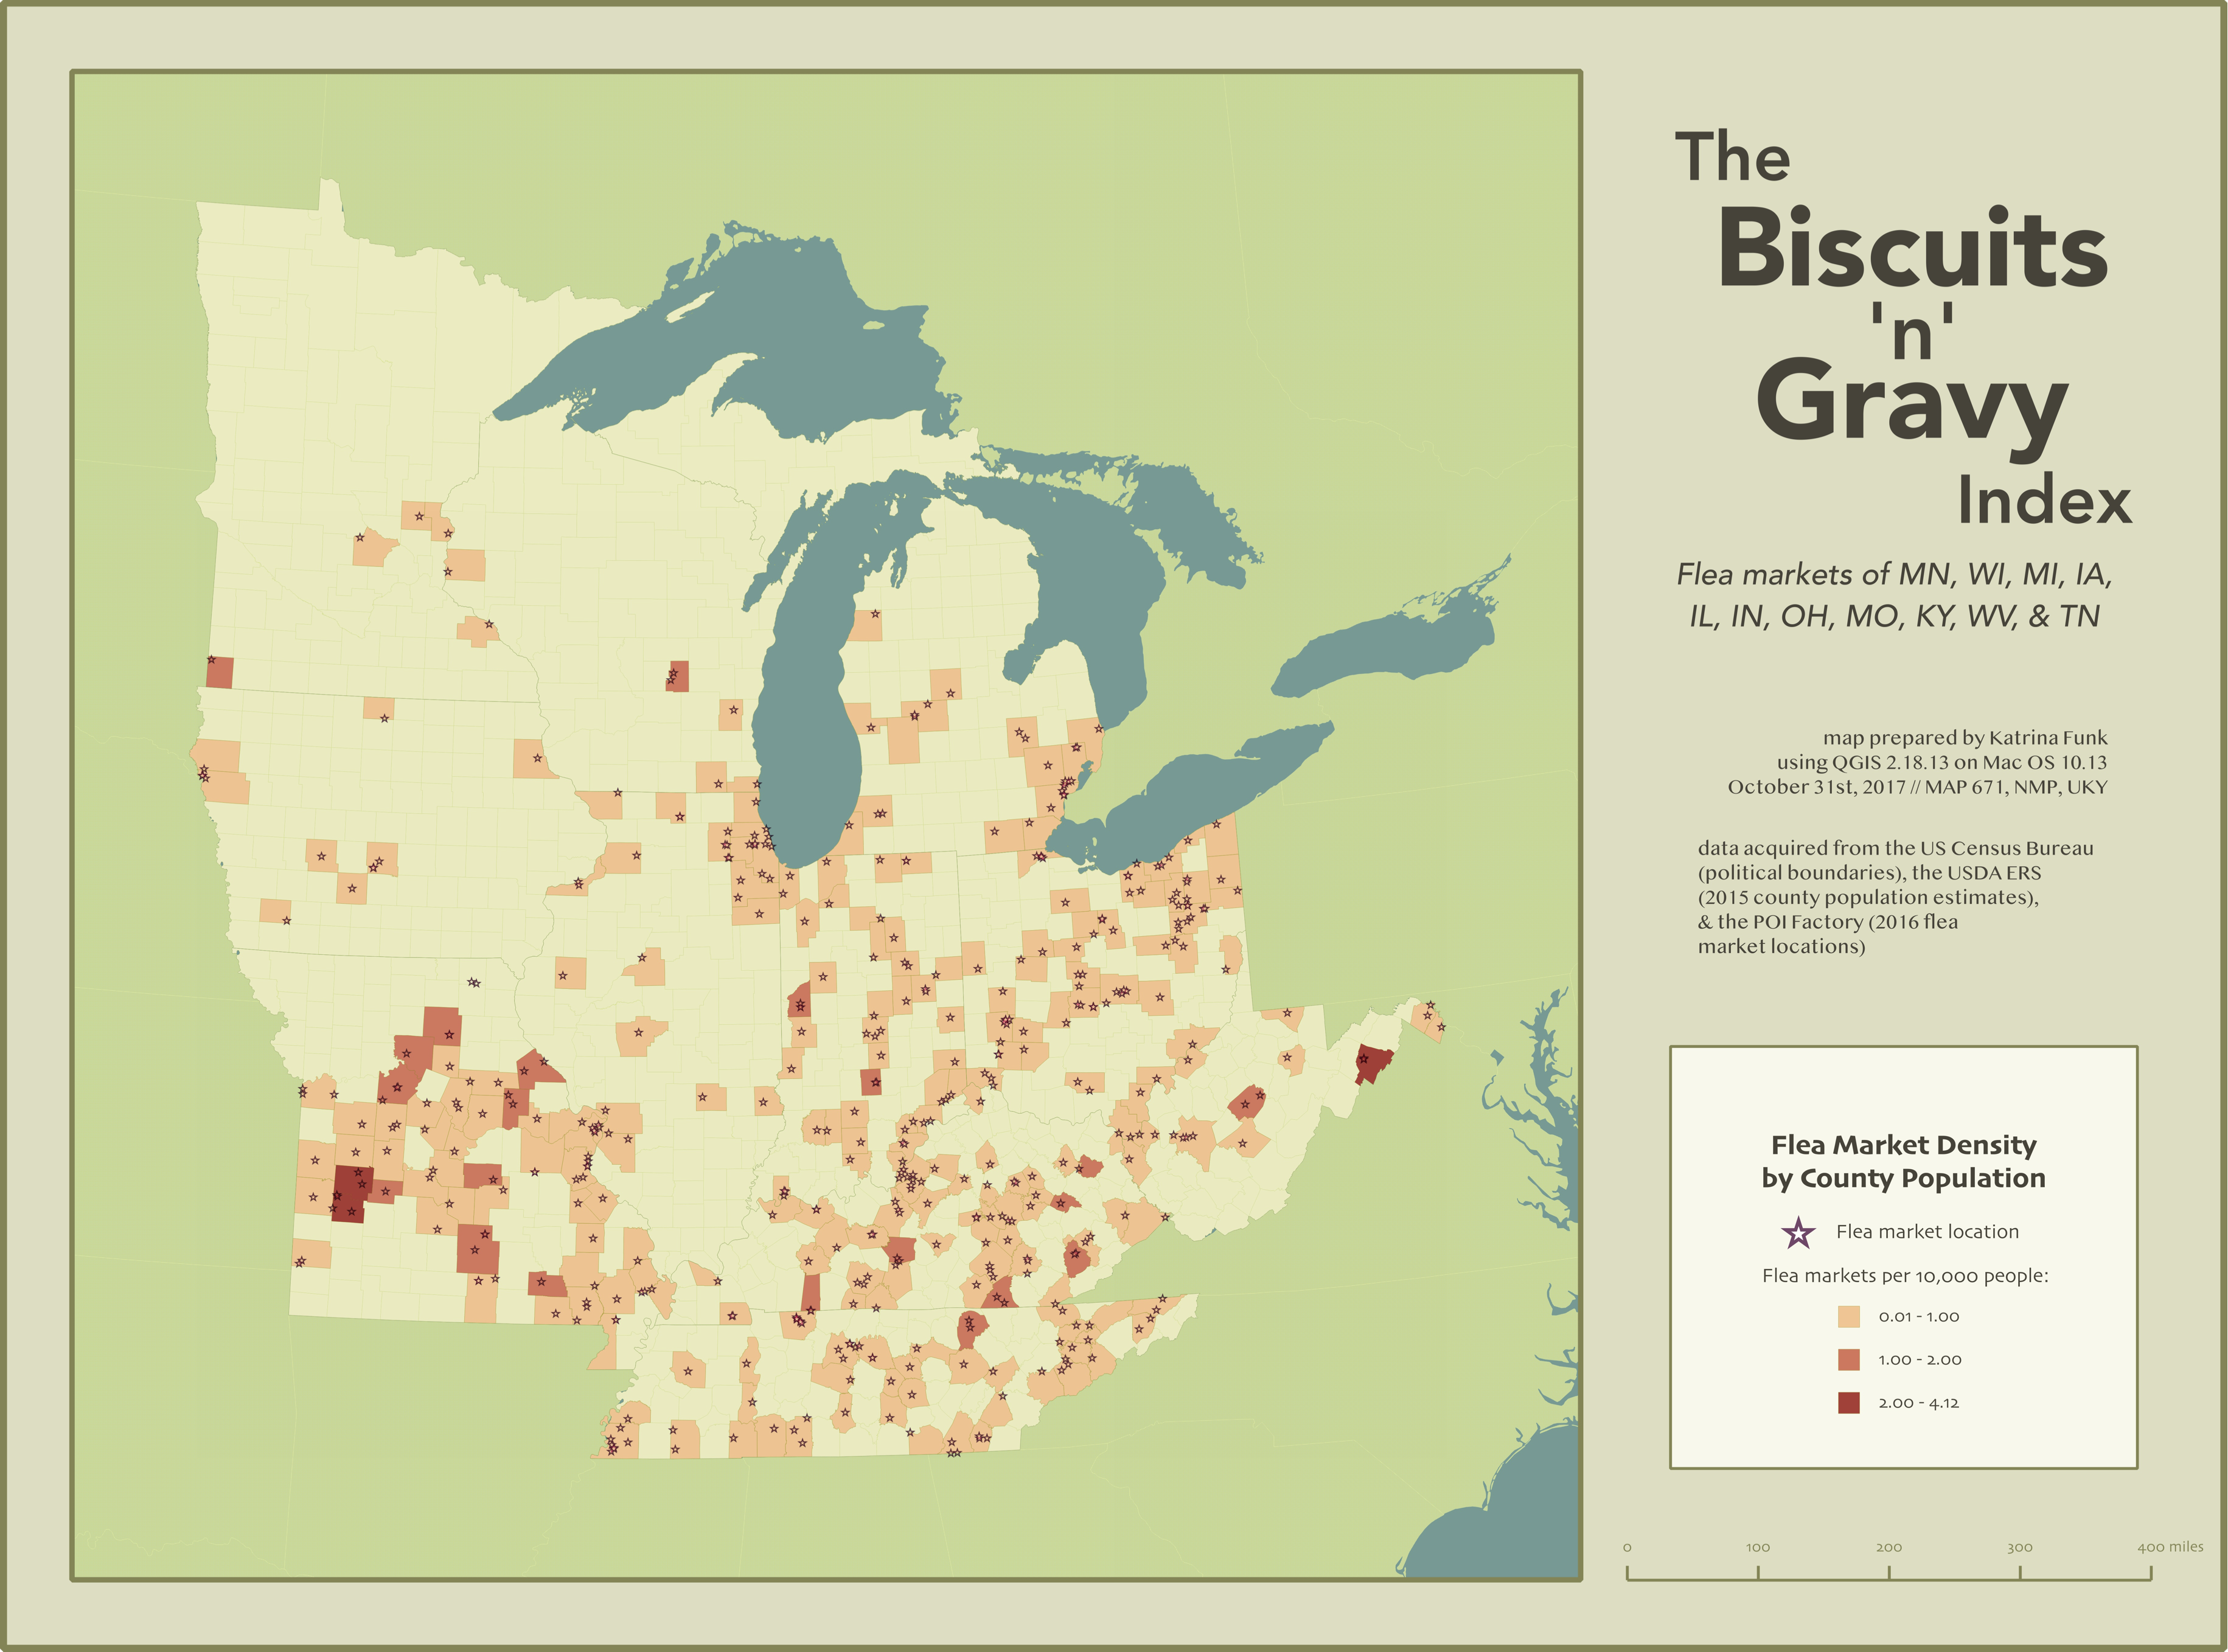
Flea market density by county across some midwestern-ish states. Made in fulfillment of NMP MAP671, Module 03. Data from the POI Factory, USDA Economic Research Service, and the US Census Bureau. October 2017.
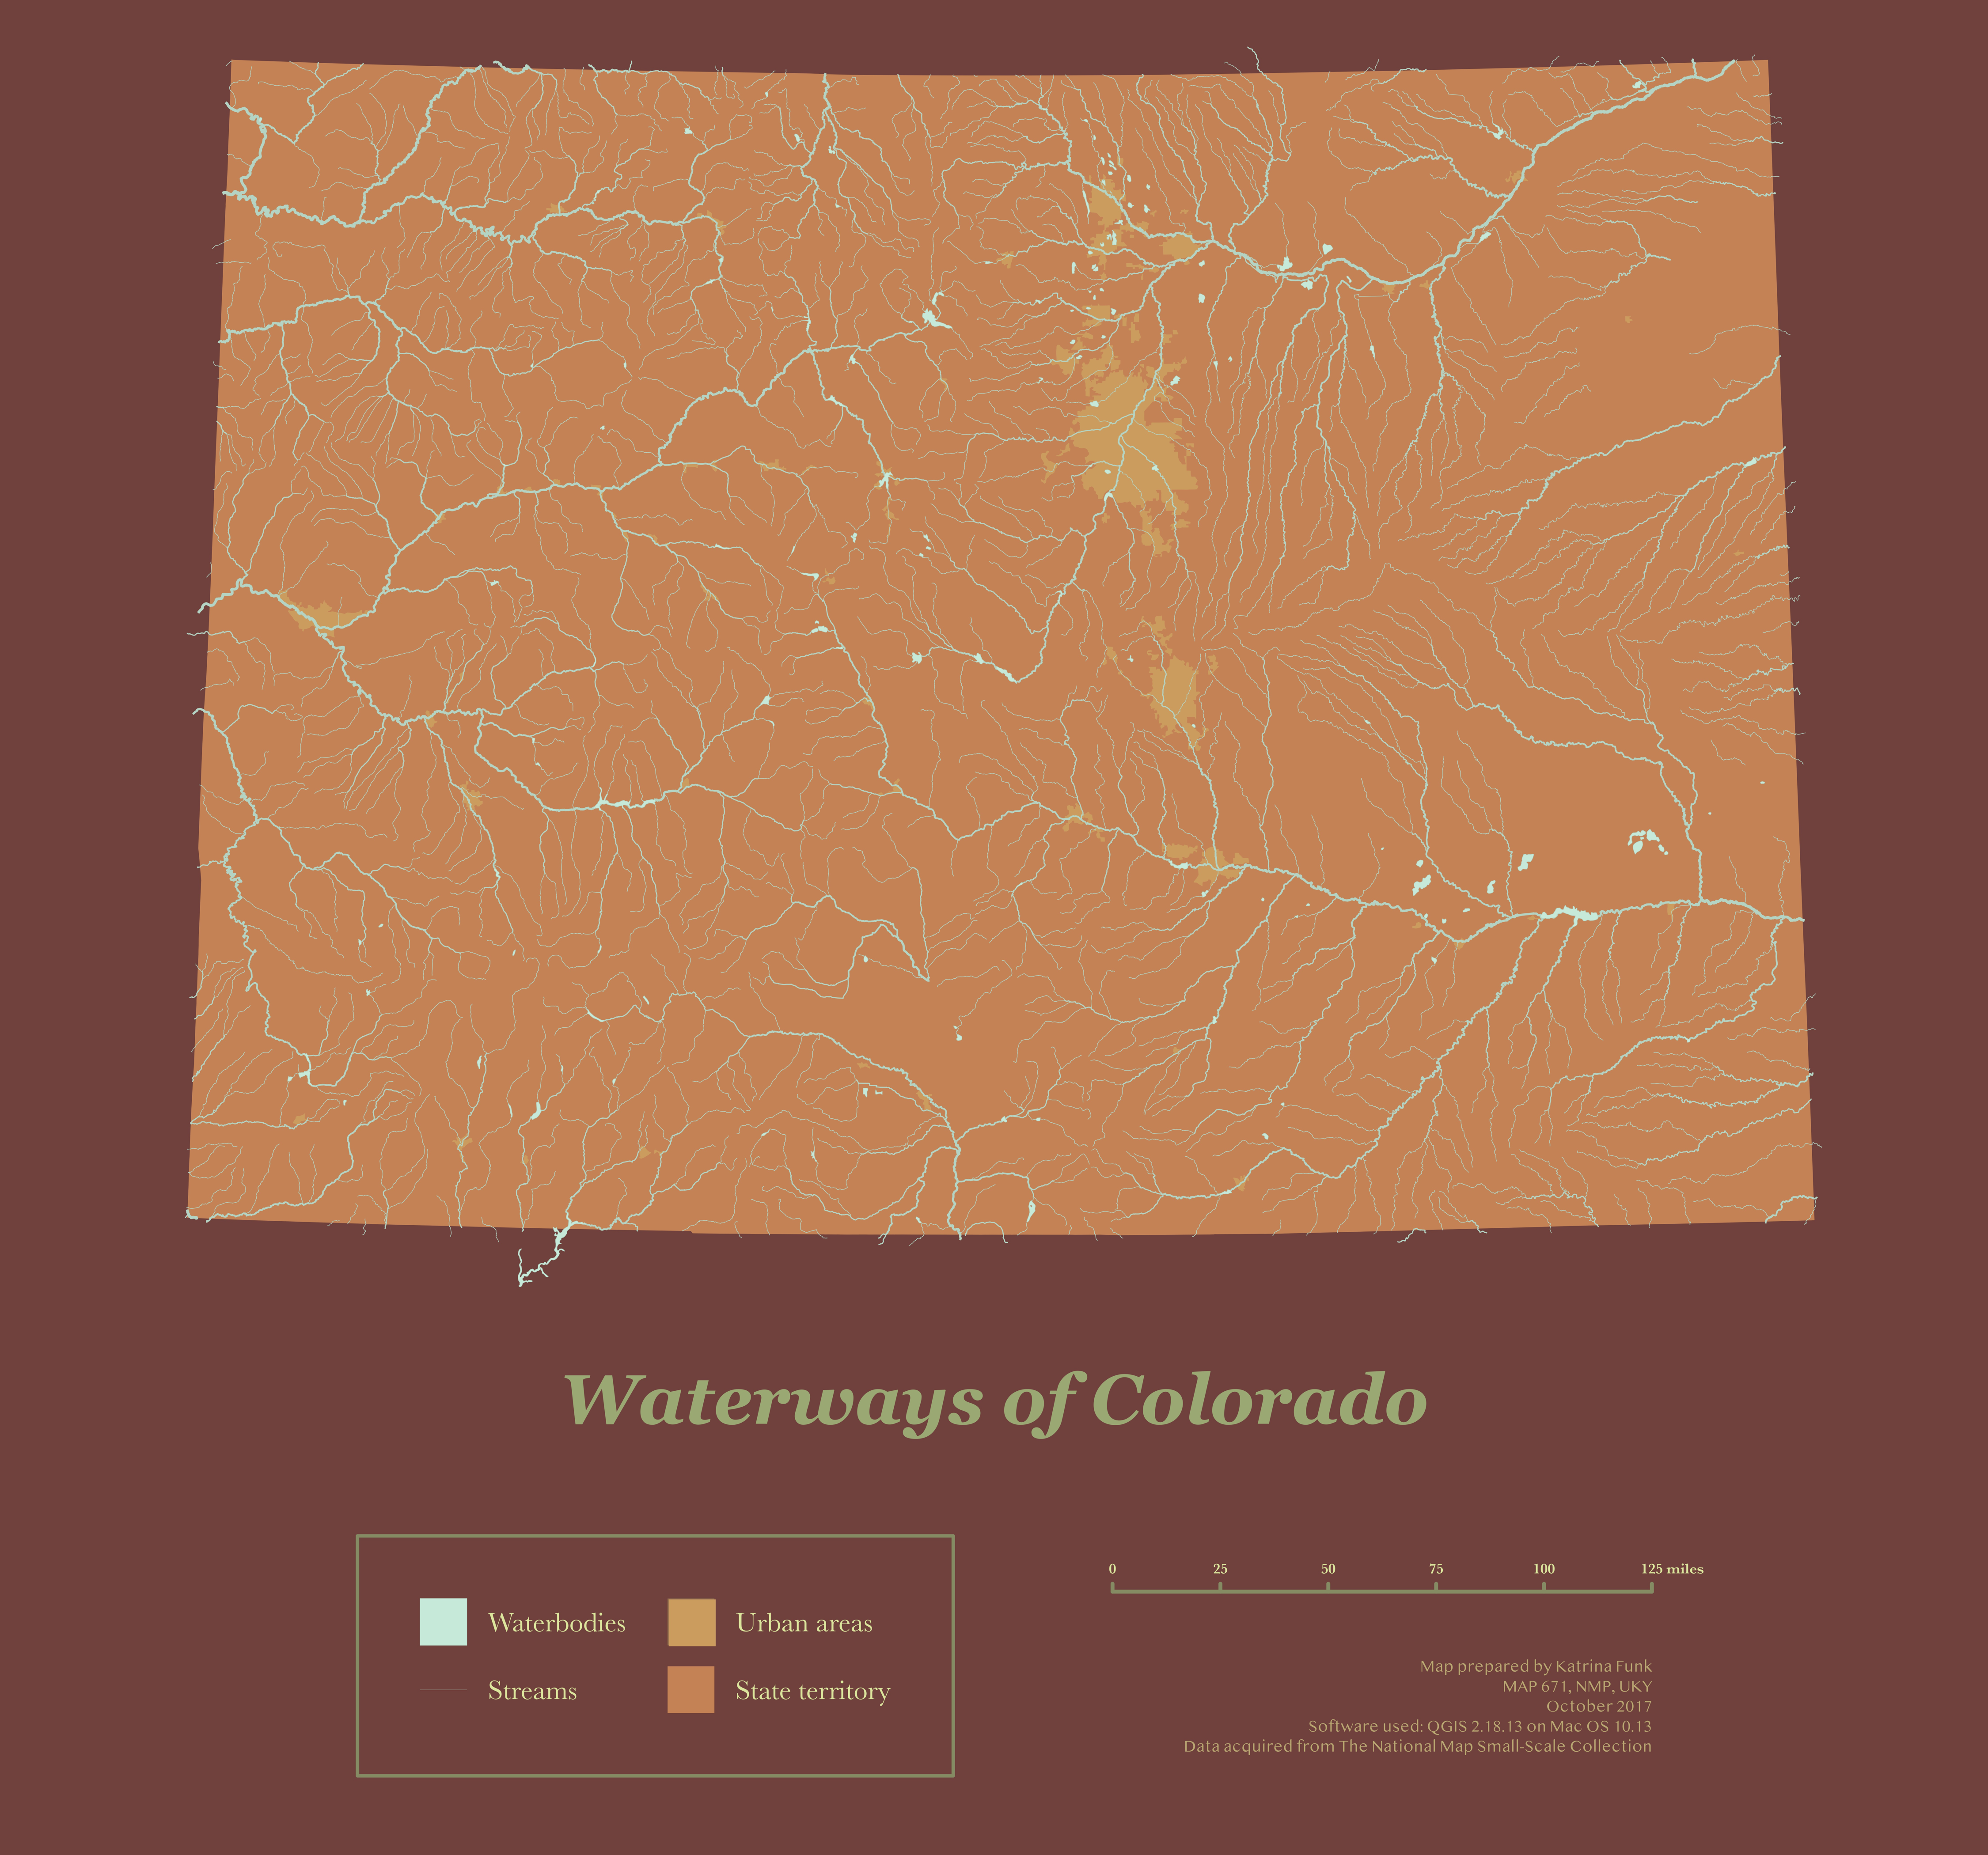
The first digital map I ever made, for NMP MAP671, Module 01. October 2017.

I am a mapper, wayfinder, mama, tinkerer, and haver-of-ideas. I can't help it: I love math & metaphor, vast perspective & tiny detail, gravity & wind. Although I'm at my wisest deep in desert canyons, this internet thing is pretty cool too, and I have spent the past several months voraciously learning all I can about the art (and heart) of digital mapping and web development.
Daily earthly practices include lakeshore pebble appreciation, dancing in the shower, and feeding myself copious amounts of apples and peanut butter.
You can call me Kit if you want.